Connect with peers, share your expertise, and inspire what’s next in Smartsheet — from proven practices to practical how-to insights from fellow users and product experts.
Sign in to join the conversation:
I have searched all the forums for the formula for the checkbox sum & none of them have worked for me. I need to total the sum of the checkboxes that are checked within a column.
I just needed to do this today.
enter '=COUNTIF', then select the entire column, and put '1' for checked.
=COUNTIF({On Track}, 1)
I don't know why, but its not working for me. I've tried this several times. I either get "unparseable" or Boolean Exp message.
It worked if it is not in the same column as the checkboxes! Is there a way to make it part of the same column so the totals are below the boxes?
If you make all of the lower rows Child rows (indent them) below the summary row, you could use...
=COUNTIFS(CHILDREN(), 1) + ""
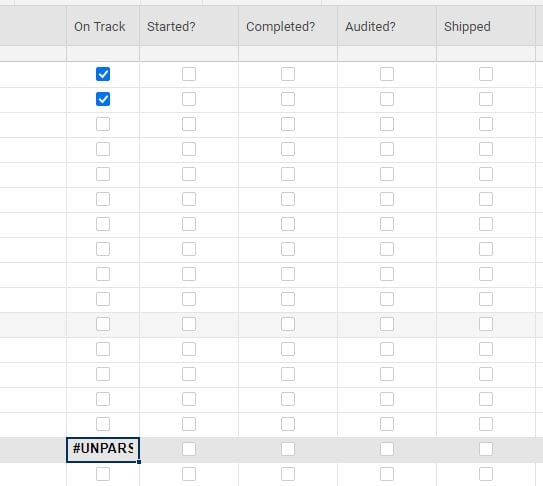
@Paul Newcome this formula helped me tremendously! Now I am facing another challenging. I am now trying to SUM the COUNTIFS totals using a CHILDREN formula to show the overarching total. I have attached an image. When I just try a general =SUM(CHILDREN( formula, nothing populates in the cell and I still see the checkbox. When I tried totaling manually at one point, instead of a SUM I somehow merged the numbers into a string (i.e. instead of 5 + 4 + 1 creating 10, I got 541).
Any suggestions on how I can total up the 23 + 17 + 1 + 0 + 0 + 0 appropriately in the North America row?
@Jen V I am at a similar situation. Did you find a way to sum in the checkbox column?
Thanks in advance.
Anyway we can make this view only for security purposes? We would like to prevent users from sending responses to other users by accident.
I am currently setting up an automation for people to get notified through their email, when they are prompted. But is there a way that they can reply in the email of a comment that will then go to the specific sheet. This way they do not have access to the sheet, but can just comment through email with updates?
Is there a way to revert to the old dashboard look and feel. The new dashboards do not look good at all. There is no way of knowing if there are additional items in the widgets until you scroll over one to learn there is more to it since the vertical bar doesn't show. We have hundreds of dashboards and they will all need…