I spent 15 hours trying to organize my data in an efficient way and just can't come up with a good solution. Smartsheet is great but SO limiting if you are used to Excel.
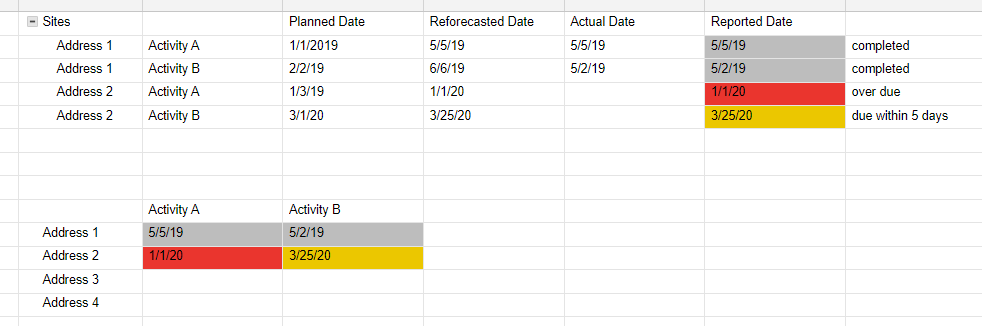
I have 200+ sites that each has 31 activities. Each activity has 3 dates - planned date, reforecasted date and actual end date. I need a report that shows just one date per activity and color codes it based on which colum it is pulling from. I created a column named "Reported Date" that pulls the appropriate date from the 3 date columns based on a formula. Then I have 3 conditional formatting rules for that column that color the dates gray if they are completed, red if they are over due and yellow if they are upcoming.
Problem I have is that I need 2 versions of the table. One that has the addresses and activities side by side (first table in my screen shot) and one that shows the addresses in rows but hte activities in columns (second table in my screen shot). The team needs to update the dates in the first table but the client needs to see the table in a format like I have in the second table.
I can get the data to transfer into the new format (second table) just fine with formulas. The problem I have is the conditional formatting. HOW can I get the dates to have the same conditional formatting without having to create 93 conditional formatting rules AND several helper columns?? When I do that, my sheet is MASSIVE and slow and just in general this is NOT best practice when you have so much data, it's a recipe for disaster.
I was hoping I can pull a report from the first table once created but reports don't let you transpose the data in a way that I need. And conditional formatting in Smartsheet is based on columns so if I have 30 columns and 3 formatting rules per column (gray, red and yellow) then I need 90 rules. Plus in order for the sheet to recognize which date is gray/complete, I need a helper column for EACH cell. Like I said, MASSIVE sheet for no reason except that Smartsheet isn't SMART.
Any other ideas how I can organize my data to achieve this? So I have data in my first table that has thousands of rows. I need it to transpose to only 200 rows with 31 columns. The only issue I'm encountering is the color coding! I'm thinking this is impossible in Smartsheet but wanted to check before I completely give up.
Thank you!!
