Today's Rabbit Hole: Charts.
Here's some things I did not know or thoughts I had today:
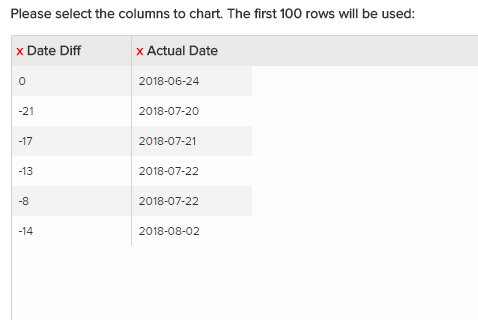
1. When building a Chart in a Dashboard, can I somehow import an existing Chart built using Smartsheet Labs?
(From Reports, Labs allows 100 rows of data, Dashboard widget allows 500 rows of data)
2. In Labs, is it possible to switch column order or do I need to build a special report for that?
3. Is adding Gantt Chart choice to the options likely in the near future (2018)?
4. Is adding a Scatter Chart choice to the Dashboard widget options likely in the future (2018)?
I am not proposing any of these as enhancement requests. The only one that I consider of more than middling importance (at the moment), is #1 as it impacts my calculations for ROI on moving existing charts from Labs to something else -- if I have to recreate them anyway, then there is no additional barrier to moving them to PowerBI or Tableau.
Craig
ps: There is no Labs or Dashboard functionality listed in Community post tags. Sights are still listed as Sights.