Stacked Bar Graph - Reflect 3 columns
Can't figure out how to use 3 columns for a staked bar chart in Smartsheet.
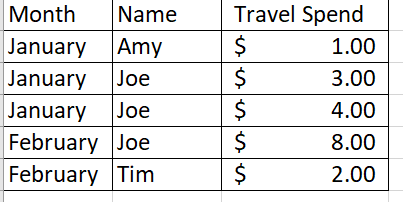
Please see attachment. For example, I'd like one column to show all costs for January, with Amy and Joe's costs would be broken out by color. Is this possible? If yes, could you please explain directions?
I can only figure out how to use two columns total.
Comments
-
Hello,
Charts only graph numerical data —any text to the left of the numerical data can be used as a data label. If you have more than one column containing text values, the leftmost column will be displayed in the chart.
To create a stacked bar chart with this data, I created a column for each month (you may want to consider using a separate sheet for this) and entered each person's name in separate rows.
You may also want to consider using cross sheet formula to sum the total travel spend for each person every month. If needed, more information on this can be found in our help articles:
- Cross-sheet formulas: https://help.smartsheet.com/articles/2476606-formulas-reference-data-from-other-sheets
- SUMIF: https://help.smartsheet.com/function/sumif
Your chart will look something like the image I've attached.
-
I am trying to create the same kind of chart with 3 variables. However, all the values are not displayed when created in my dashboard. Suggestions?
Categories
- All Categories
- 14 Welcome to the Community
- Customer Resources
- 64.8K Get Help
- 437 Global Discussions
- 138 Industry Talk
- 470 Announcements
- 4.9K Ideas & Feature Requests
- 129 Brandfolder
- 148 Just for fun
- 65 Community Job Board
- 486 Show & Tell
- 33 Member Spotlight
- 2 SmartStories
- 300 Events
- 36 Webinars
- 7.3K Forum Archives